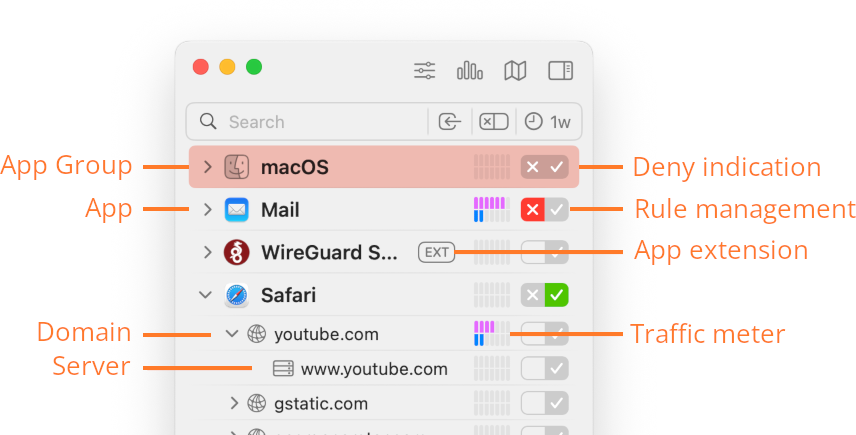
Connection list
Overview

- App — Name and icon of the process communicating.
- App Group — Background processes of macOS and iOS/iPadOS/watchOS/… simulator processes are grouped into separate app groups.
- Domain — Servers are grouped by their domain. In most cases, this information is sufficient and you can leave the details hidden.
- Server — Name used to connect to the server.
- Traffic meter — Displays the current data rate for received and transmitted data, or, as an option, the data rate history of the last 5 minutes. When sorting by traffic amounts, these meters are replaced with bars indicating the amount.
- Rule management — This double-button shows which rules are currently effective and can be used to create or delete rules with a single click.
Learn more about managing rules in Network Monitor… - Deny indication — When a connection is denied, the corresponding line flashes red in real time to indicate the event.
- App extension — This badge indicates that the connection was made by an app extension bundled with the app, not by the app itself. In the example above, WireGuard has a bundled Network Extension which does the actual work.
Little Snitch records all network connections established by processes on your computer, and shows them in the connection list of Network Monitor. Connection data is collected for up to one year, limited to 50,000 distinct connections by default. This limit can be increased to up to 200,000 in Settings.
In order to work with such a large list of connections, Network Monitor can filter the list by various criteria.
Hierarchy of grouping
By default, Network Monitor groups connections into the following hierarchy:
- App Group (omitted if app is not in a group)
- Responsible App
- Connecting Process (omitted if responsible app connects directly)
- Incoming/Outgoing (omitted for outgoing connections)
- Localnet/Internet (omitted for Internet)
- Domain
- Host
- Domain
- Localnet/Internet (omitted for Internet)
- Incoming/Outgoing (omitted for outgoing connections)
- Connecting Process (omitted if responsible app connects directly)
- Responsible App
Click the disclosure triangle to expand the details of a line. When you hold down the option key while clicking, details are expanded recusively. When you hold down the command key, more items lines are also expanded. And if you hold down both modifiers, details and their more items lines are all expanded recusively.
Alternative grouping hierarchies are available and can be chosen in the view options. There are options which reverse the hierarchy (domains first, then apps) and options which include grouping by country.
Sort order
The sort order of connections can be changed in the view options:
- sort by last network activity (default)
- sort by Name
- sort by total traffic amount within displayed time period
- sort by traffic amount sent within displayed time period
- sort by traffic amount received within displayed time period
When sorting by traffic amounts, the amount based traffic meters are used. For all other sort orders the meters configured in Settings are used.
Traffic meters
| STYLE | DESCRIPTION |
|---|---|
 |
Indicates the current data rate. |
 |
Indicates the amount of data transferred within the last five minutes, each bar representing approx. 40 seconds. |
 |
Indicates the amount of data sent (pink on the left) and received (blue on the right). |
 |
Indicates the amount of data sent. |
 |
Indicates the amount of data received. |
Context menu
Each row in the connection list has a context menu which can be accessed via right-click. Options related to rule management are discussed in a separate section.
- Capture Traffic… — Opens a Terminal window prepared with a command to capture traffic in
.pcapformat (to be opened with Wireshark). You must enable Access via Terminal in Settings > Security to run the command. - Remove from List — Deletes all connections represented by the selected row. Traffic totals related to these connections will no longer include the deleted connections in the displayed sum total. There is no undo for this operation!
Hidden connections
Network Monitor collects a plethora of information about all the Internet connections of the programs you use. Although this information is protected from access by others (using encryption), you may prefer if particular data is not collected or stored to begin with. For instance, you may live in a country where visiting certain websites can get you into trouble and you don’t want any traces to be stored on your computer.
Little Snitch offers a mechanism that deals with this: Rules to Hide Connections. If such a rule matches a connection, Network Monitor summarizes traffic statistics in a single Hidden Connections row. These rules can be created in Little Snitch Configuration or in the context menu when you right-click on a process in the connection list.
Was this help page useful? Send feedback.
© 2016-2026 by Objective Development Software GmbH