Dieser Abschnitt ist leider noch nicht auf Deutsch verfügbar. Wir entschuldigen uns für die Unannehmlichkeiten.
Traffic Chart
The Traffic Chart provides a graphical representation of your computer’s network activity. It lets you view and analyze data volumes in a resolution of one second (for the most recent traffic) and in a time frame of up to one year (with a resolution of one hour).
The Traffic Chart always represents the data transferred by the connections selected in the connection list, or all visible connections if none are selected.
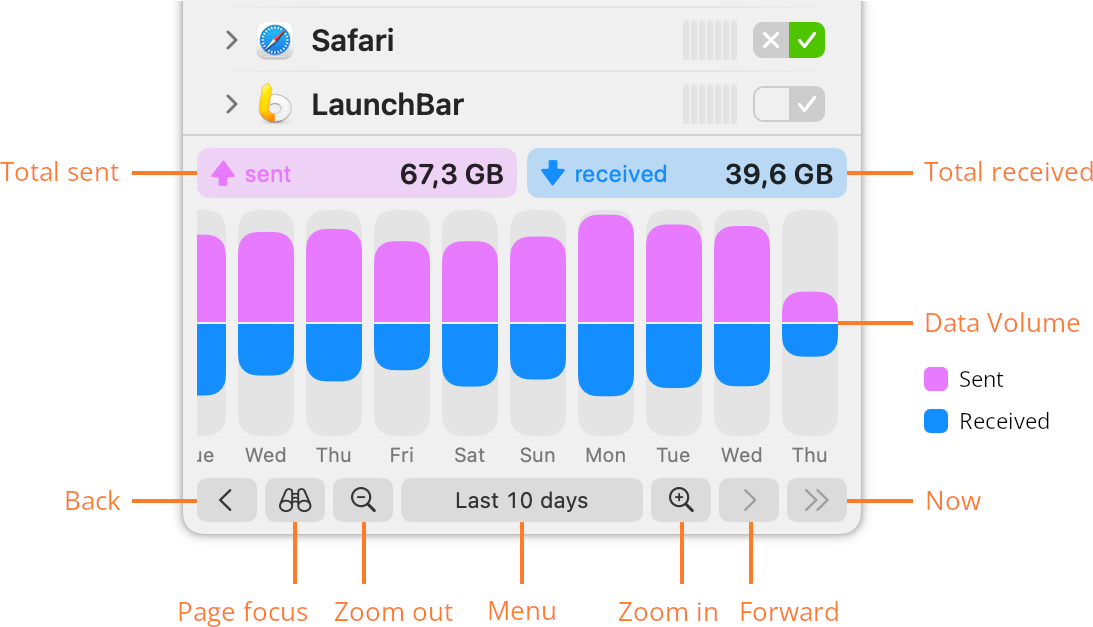
- Total sent — Total number of bytes sent in the visible time range or in the hovered bar.
- Total received — Total number of bytes received in the visible time range or in the hovered bar.
- Data Volume — Chart representation of the data sent and received per time unit over time.
- Back — Scroll back to older traffic data by one page.
- Page focus — Focus on a common time range such as a day, a week, a month or similar.
- Zoom out — Zoom out by one step.
- Menu — Show a menu of zoom options. This menu button also displays information about the displayed, selected or hovered time range.
- Zoom in — Zoom in by one step.
- Forward — Scroll forward to newer traffic data by one page.
- Now — Scroll forward to see the current time.
You can hover over the bars in the chart to see the amounts of data sent and received and the time range represented by the bar.
Selecting a time range
You can select a time range by dragging over the respective bars. When a time range is selected, the numbers for bytes received and sent refer to the selected range. The time range is also applied as a filter to the connection list and the list narrows down to show only connections which had relevant events during that time (data sent or received, connections established, denied by a rule). The sort order temporarily switches to traffic amounts so that it is easier to analyze which connection caused the traffic seen in the diagram.
Who has caused that traffic peak? When you select a time range in the Traffic Chart, the connection list and Map View focus on connections that actually had any traffic during that time. If you see a traffic peak in the diagram, you can select it to see which process caused it.
War dieser Eintrag hilfreich? Hinterlass uns Feedback.
© 2016-2026 Objective Development Software GmbH