 Little Snitch 5 Help
 Little Snitch 6 Help
 Little Snitch 7 Help
Status menu
Displayed information
| MENU ICON | DESCRIPTION |
|---|---|
 |
Network activity not shown (preferences option). |
  |
Traffic meters showing current received and transmitted data rates. There is a preferences setting whether meters are shown monochrome or in color. |
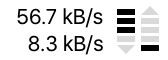 |
Traffic meters with numeric data rates. There is a preferences setting whether numeric rates are shown. |
 |
Blocked connection attempt. At the moment a connection is blocked, a red cross flashes in the traffic meters. |
  |
Current operation mode: In Alert Mode there are just the Traffic meters. But in Silent Mode, there is an additional dot drawn in green (Silent Mode — Allow Connections) or red (Silent Mode — Deny Connections). |
 |
Network Filter is off: A warning symbol is shown when the network filter is off. |
 |
Traffic Capture is running: A blinking symbol is shown to indicate when a traffic capture is running. |
Available menu actions
The status menu provides access to frequently used options:
- Opening Network Monitor, Little Snitch Configuration and Preferences.
- Switching between Silent Mode and Alert Mode.
- Activate profiles.
- When a traffic capture is running, an option to stop it.
- Drag an application on the status menu icon to create a new rule for it.
Configuration options
Choose Little Snitch Preferences from the status menu and switch to the Network Monitor section. There you can change the appearance of the status menu icon:
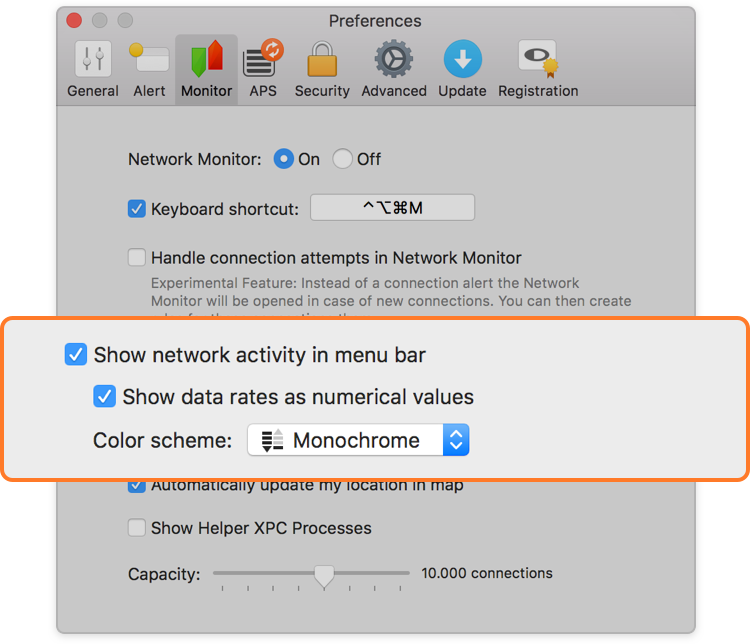
- Show network activity in menu bar — With this option turned on the status menu shows an animated traffic meter.
- Show data rates as numerical values — With this option turned on the status menu shows data rates as numerical values in addition to the traffic meter.
- Color scheme — Choose whether to display traffic meters in color (red and green) or monochrome.
Two more options are in the General preferences section:
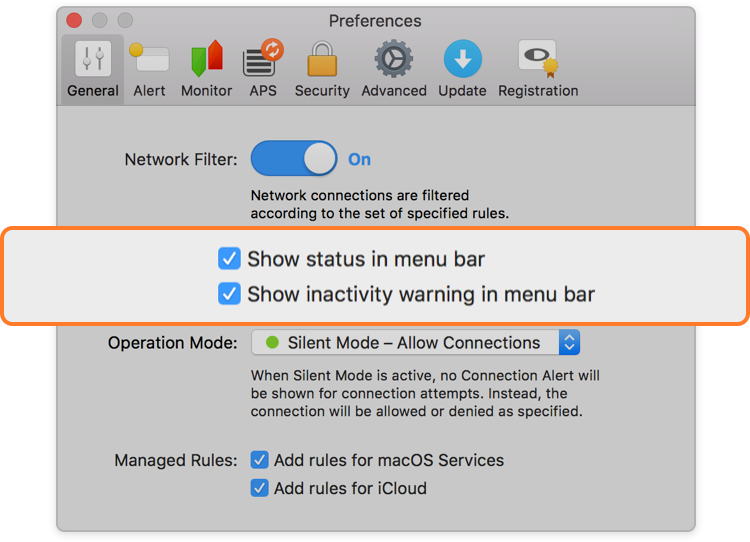
- Show status in menu bar — Choose whether the status menu shall be shown at all.
- Show inactivity warning — With this option turned on the status menu displays a yellow warning triangle when the network filter is off.
© 2016-2026 by Objective Development Software GmbH