Connection Inspector
The Connection Inspector is opened in one of the following ways:
- Click the “Show Inspector” button in the tool bar of Network Monitor’s window.
- Double-click an item in the Connection List.
- Choose View > Show Inspector from the main menu.
- Keyboard shortcut: Command-I
In fact, there are two types of Connection Inspector: a detail inspector for selected connections and a summary inspector when nothing is selected.
Summary Connection Inspector
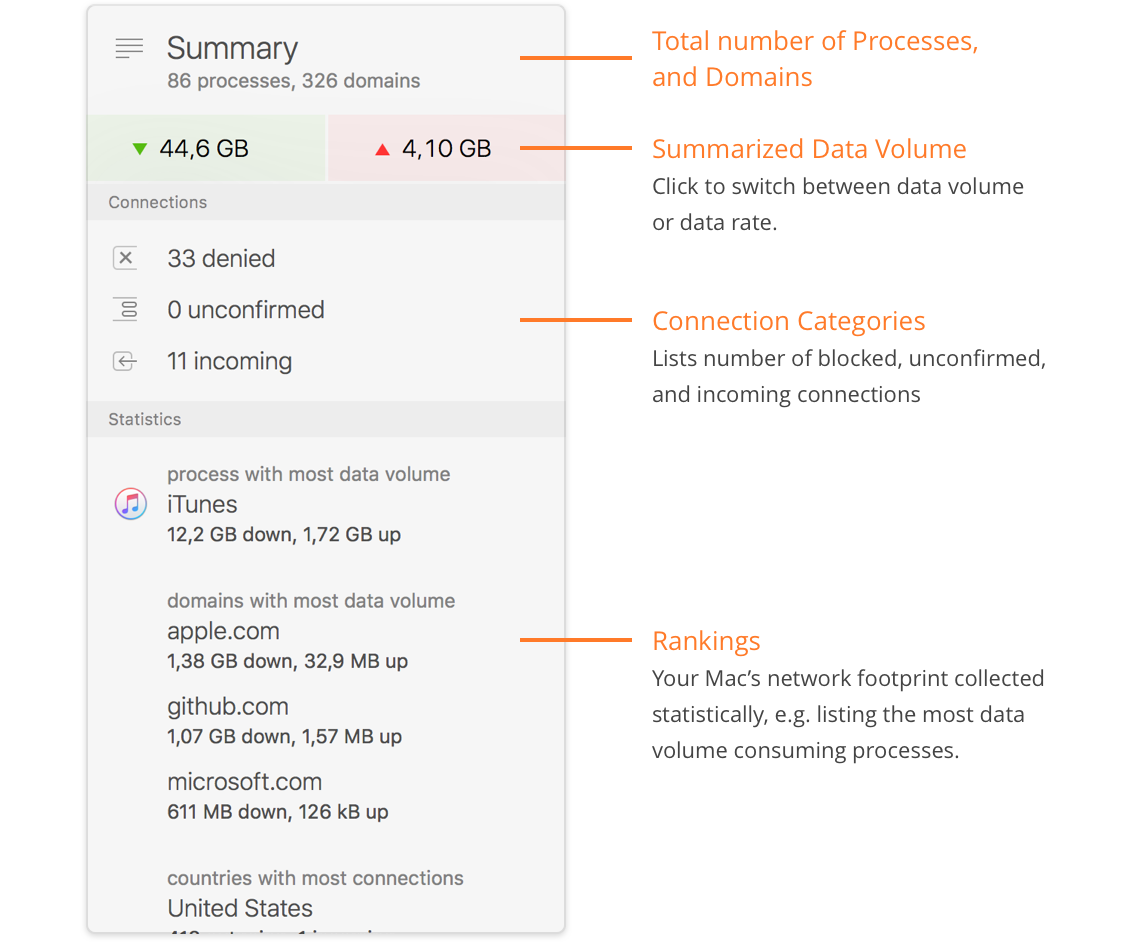
If no connection is selected, a summary over all items shown in the Connection List is displayed.

- Summary — Counts of unique processes and domain names found.
- Summarized Data Volume — Total amount of data sent and received. When you click into the line, display toggles between total amounts and current data rates.
- Connection Categories — Counts of connections matched by a deny rule (denied), connections that had activity during Silent Mode which has not yet been confirmed and connections established by a remote computer (incoming). Click any of the lines to filter on denied, unconfirmed or incoming connections.
- Rankings — This section contains top ranking statistics: the process with greatest amount of data transferred, domains with greatest amount of data transferred and countries with the greatest amount of connections.
Detail Connection Inspector
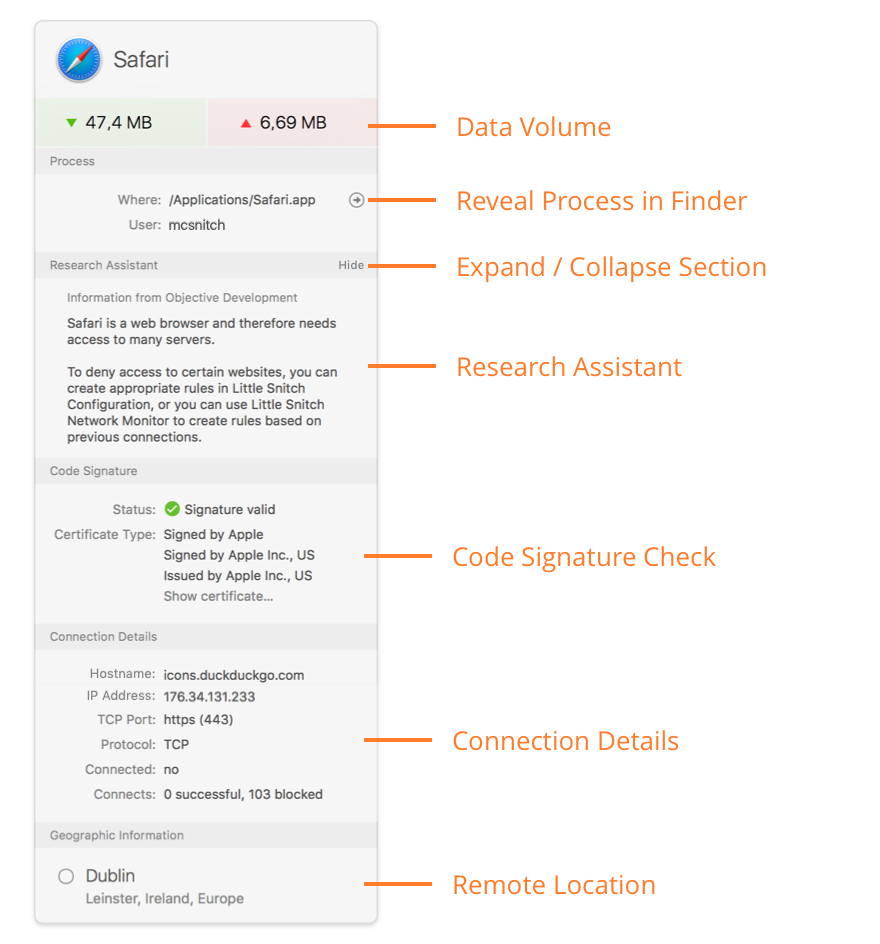
If at least one connection is selected, a summary for the selected connections is shown:

- Data Volume — Total amount of data sent and received. When you click into the line, display toggles between total amounts and current data rates.
- Process Information — File system path of the process and name of the process owner. The owner is the user who started the process.
- Research Assistant — The Research Assistant may provide more information about the purpose of the connection.
Learn more about Research Assistant… - Code Signature Check — This section shows whether the application or executable on disk has a valid code signature and who signed it.
Learn more about Code Signatures… - Connection Details — Shows information about the remote endpoint of the connection and statistics information. the following information is available:
- Hostnames used to connect. Click on a hostname to filter on this particular host.
- Internet addresses obtained for the hostname and used for the actual connection. Click on an Internet address to filter on that particular address.
- TCP and UDP ports connected to. Click a port number to filter on that particular port and protocol.
- Protocols used for the connection. Click on a protocol to filter on that particular protocol.
- Whether the connection is currently established (for connection based protocols).
- How often the connection has been established (for connection based protocols) and how often an attempt has been blocked.
- When the connection was first seen by Network Monitor.
- When the last activity occurred for the connection.
- Geographic Information — City, state, country and continent information for the remote endpoint of the connection. If multiple locations are involved, only the parts common to all of them are shown. You can click any entity to filter on it.
Ports, protocols and Internet addresses — The connection list is hierarchical, but only down to server names. Information on Internet address, protocol and port level are still stored, though. If you want to see statistics or a Traffic Diagram for a particular port, protocol or IP address, just filter on it.
Absolute dates — Dates are often given as relative times (e.g. 25 minutes ago) or in ISO format. Hold the ⌥-key while the inspector window is active to show them as absolute dates in your preferred localized format.
Was this help page useful? Send feedback.
© 2016-2026 by Objective Development Software GmbH