Capturing traffic
When processes exchange data with remote servers, you may want to know what data they actually send and receive. You can use a network sniffer like Wireshark, but these tools record traffic of your entire computer, not just a particular process. Filtering out the relevant data is tedious.
Network Monitor offers an option to record all traffic for a particular process in PCAP format.
Start and stop a capture
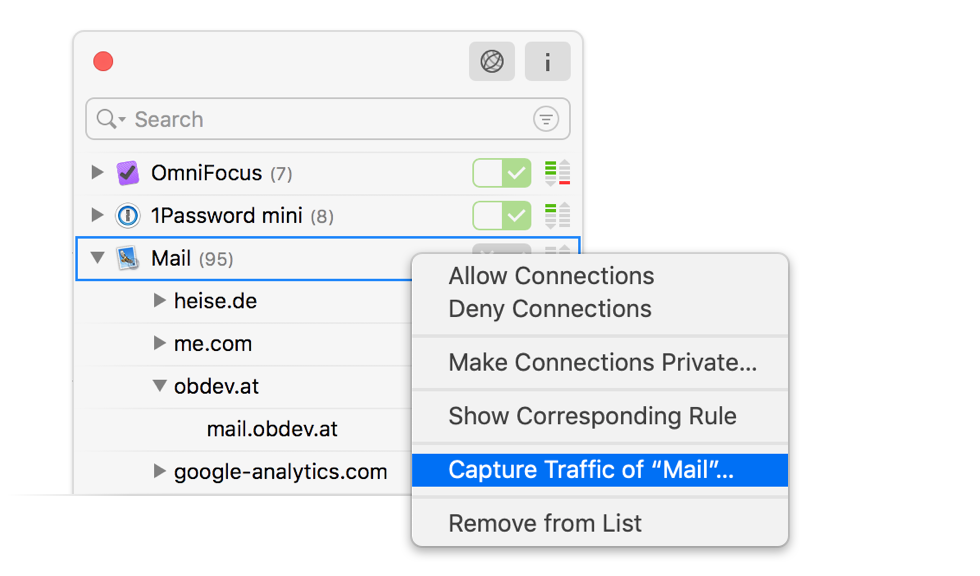
To start capturing traffic of a certain process, right-click the process in Network Monitor’s Connection List and choose Capture Traffic of … from the context menu. Little Snitch starts capturing immediately while you choose a name for the file. Little Snitch can run any number of simultaneous traffic captures.
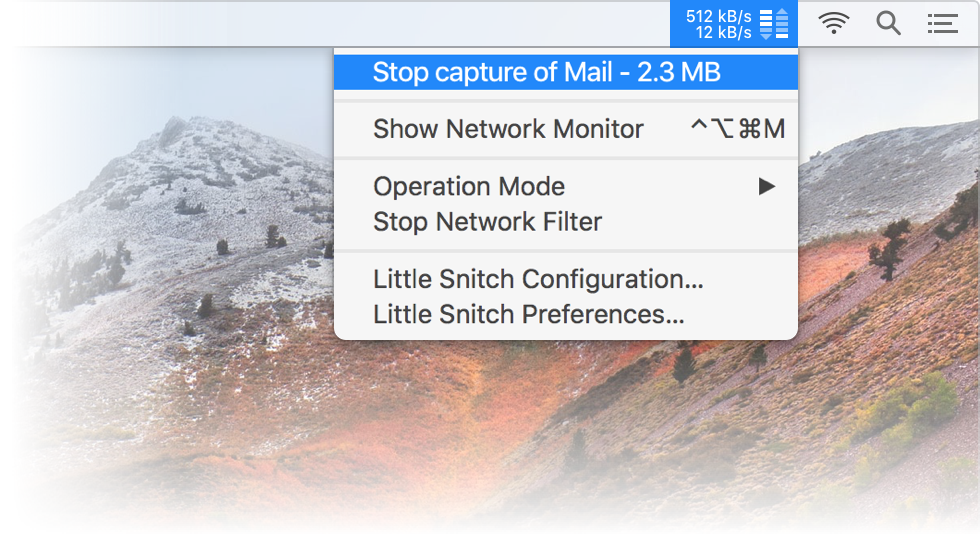
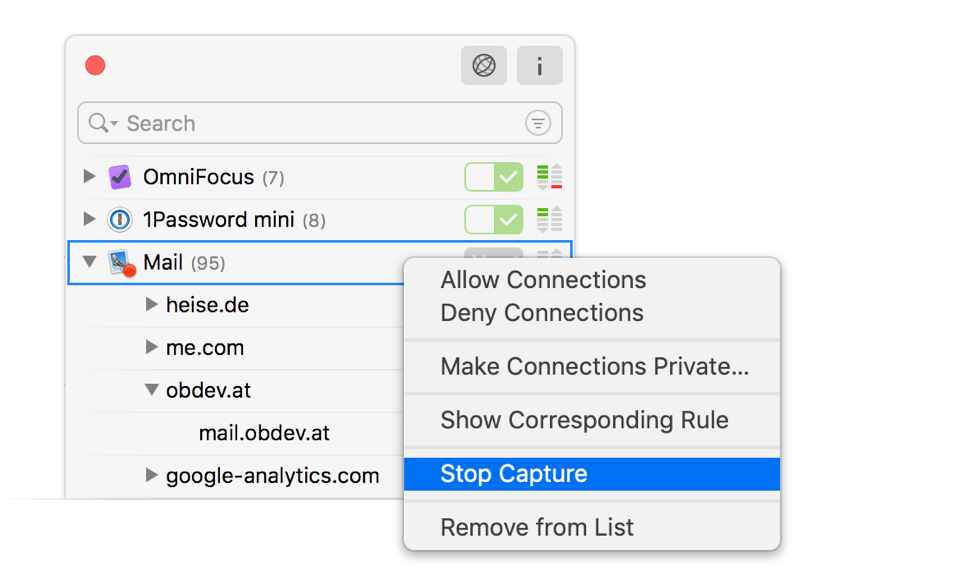
To stop a running capture, you can either click Little Snitch’s status menu item (where a red recording indicator is blinking) and choose Stop Capture of … or right-click the connection being captured in the Connection List and choose Stop Capture from the context menu.
Interpret captured data
In order to understand the results of a traffic capture, you must know that Little Snitch intercepts traffic at the application layer, not at the network interface layer as other sniffers do. This is what distinguishes Little Snitch from conventional firewalls, after all. At this layer, however, it is not yet known via which network interface the data will be routed (which sender Internet address will be used) and sometimes it is not known which sender port number will be used. It is also not known whether and how the data will be fragmented into packets. All this information is required in order to write a valid PCAP file. Little Snitch simply makes up the missing information. It fakes TCP, UDP, ICMP, IP and even Ethernet protocol headers. Missing information is substituted as follows:
- Ethernet (MAC) address – Sender and recipient address are both set to 0.
- Local IP (v4 or v6) address – Numeric Process-ID of process.
- Local TCP/UDP port number – Kernel’s socket identification number.
- Packets are always generated as large as the protocol allows (not as large as the network would allow).
Since all network protocol headers are made up, it is not possible to debug network problems (such as lost packets or retries) with these traffic captures. If you need to debug at the protocol header level, use the tcpdump Unix command or Wireshark instead.
Was this help page useful? Send feedback.
© 2016-2026 by Objective Development Software GmbH