Network Monitor
Little Snitch Network Monitor makes Internet Connections visible. It shows which application, Unix command or system service (“process”) connects to which Internet server. It also shows where this Internet server is located geographically. And it records statistics for each connection: The amount of data transferred, data rates for the last hour, ports used, …
Overview

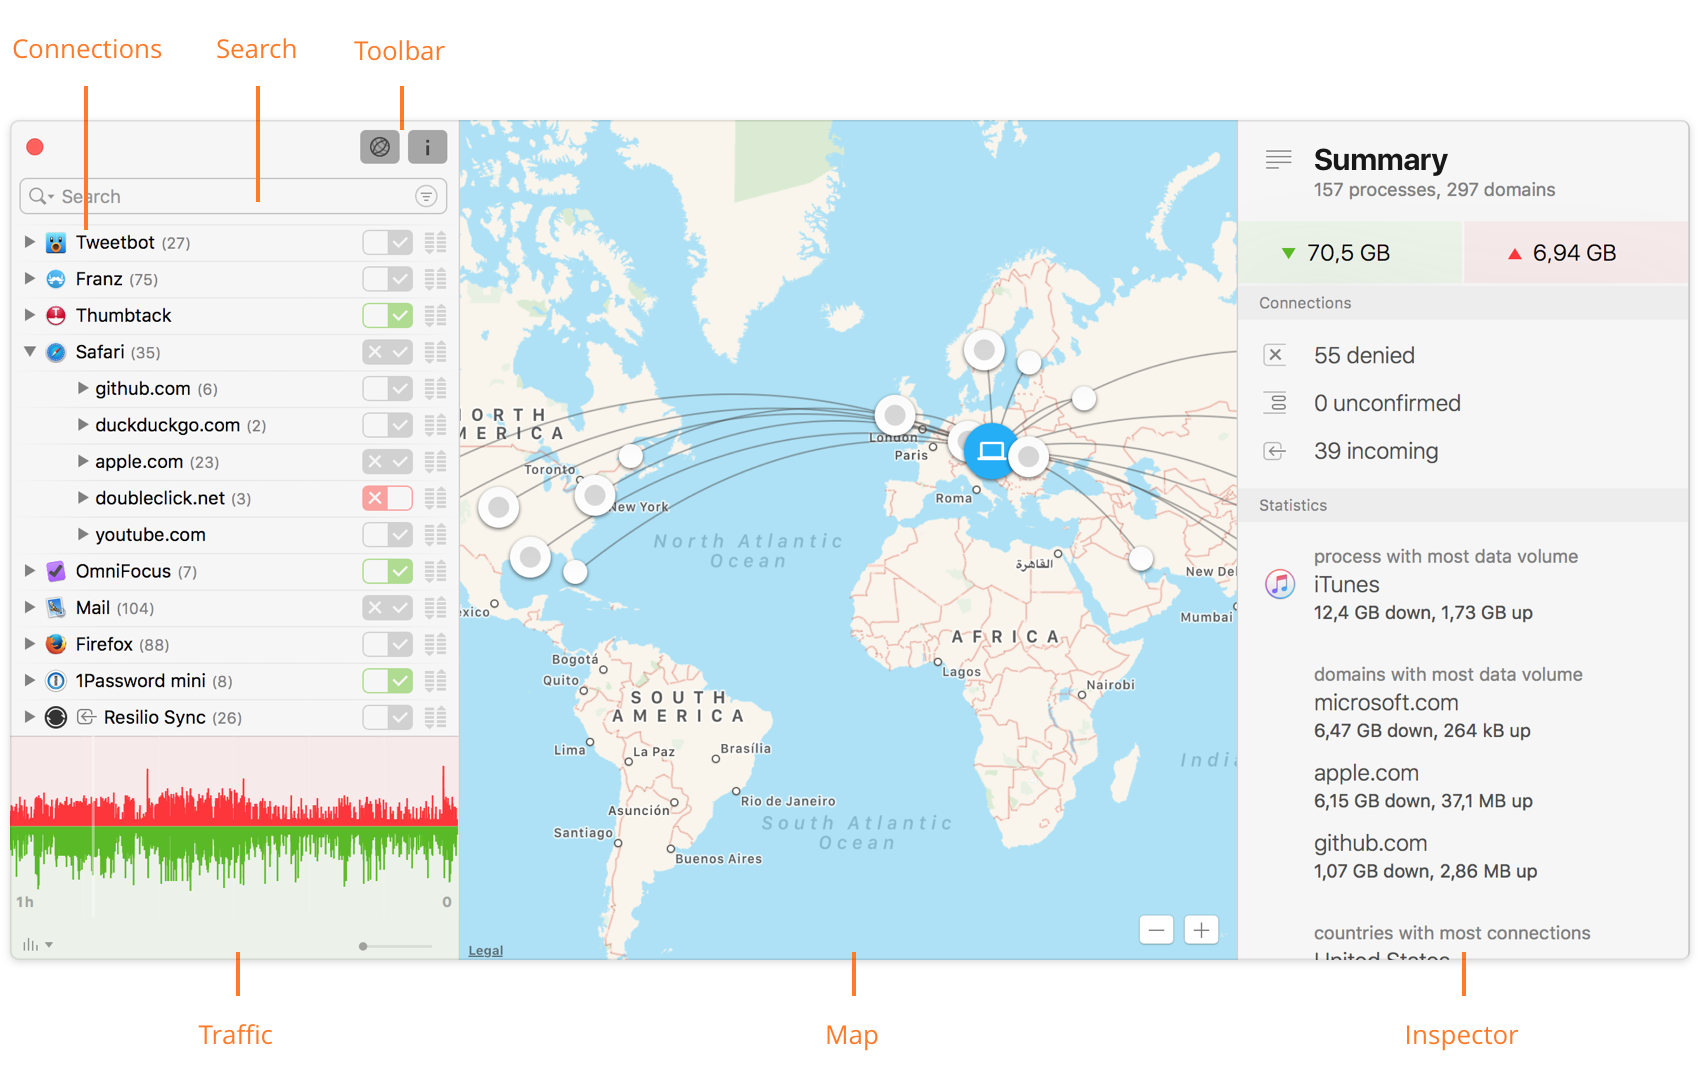
The Network Monitor window consists of the following components:
- Connections — A hierarchical list of connections seen so far. The first level lists only processes. For each of them, you can drill down to the domains it connects to by clicking the disclosure triangle. The third level lists the names of the servers which were contacted. Connection statistics are stored “forever”, up to a configurable limit of total connections.
Learn more about the Connection List… - Search — You can perform a textual search in the Connection List or apply other filters via a filter menu.
Learn more about search and filters… - Toolbar — Contains buttons for quickly showing and hiding Map and Inspector and identifies Snapshots.
- Traffic — The Traffic Diagram shows the amount of data up- and downloaded per second, as a diagram over time. For each connection it contains a complete history over the last 60 minutes.
Learn more about the Traffic Diagram… - Map — Shows geographic locations for the servers in the list. Locations are derived from Internet addresses via a database obtained from MaxMind, Inc that ships with Little Snitch. Learn more about the Map…
- Inspector — Shows all the details we know about the selected connections: Internet addresses, other server names, code signature information, geographic location names and other statistics information. It also includes a Research Assistant, which can often explain the purpose of a process and its connections.
Learn more about Connection Inspector…
Was this help page useful? Send feedback.
© 2016-2026 by Objective Development Software GmbH