Status menu
Displayed information
| MENU ICON | DESCRIPTION |
|---|---|
 |
Empty traffic meters: Network activity is not shown. There is a preferences option to disable animated traffic meters. |
  |
Traffic meters: Current received and transmitted data rates are shown. There is a preferences setting whether meters are shown monochrome or in color. |
 |
Traffic meters with numeric data rates: There is a preferences setting whether numeric rates are shown. |
 |
Blocked connection attempt: At the moment a connection is blocked, a red cross flashes in the traffic meters. |
   |
Current operation mode: In Alert Mode there only traffic meters are shown. In Silent Mode, there is an additional dot drawn in green (Silent Mode — Allow Connections) or red (Silent Mode — Deny Connections). |
 |
Network Filter is off: A warning symbol is shown when the network filter is off. |
Available menu actions
The status menu provides access to frequently used options:
- Opening Network Monitor, Little Snitch Configuration and preferences.
- Switching between Silent Mode and Alert Mode.
- Activate profiles.
Configuration options
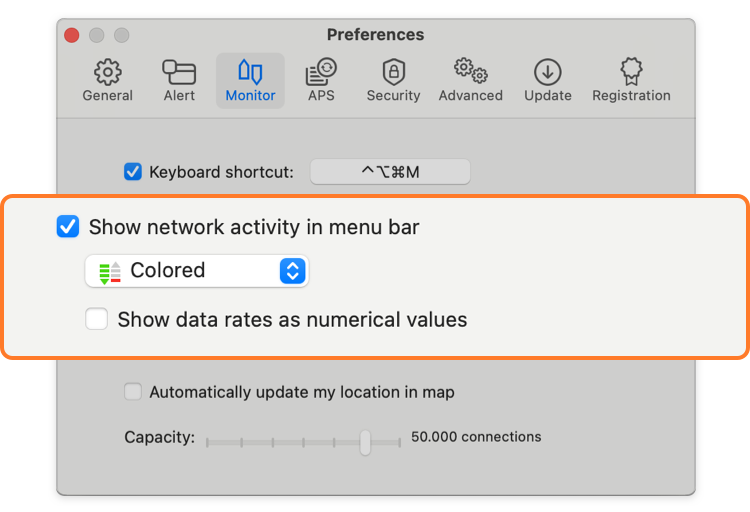
Choose Little Snitch Preferences from the status menu and switch to the General preferences section. There you can change the appearance of the status menu icon:

- Show network activity in menu bar — With this option turned on the status menu shows animated traffic meters.
- Show data rates as numerical values — With this option turned on the status menu shows data rates as numerical values in addition to the traffic meters.
- Color scheme — Choose whether to display traffic meters in color (red and green) or monochrome.
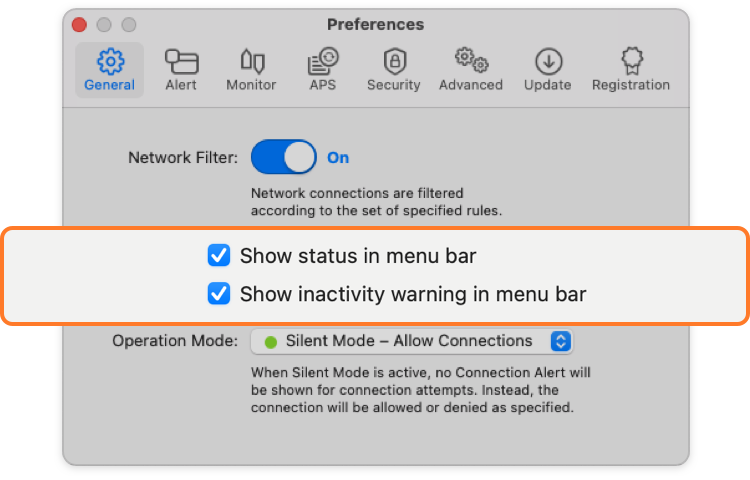
Two more options are in the General preferences section:

- Show status in menu bar — Choose whether the status menu shall be shown at all.
- Show inactivity warning — With this option turned on the status menu displays a yellow warning triangle when the network filter is off.
Was this help page useful? Send feedback.
© 2016-2026 by Objective Development Software GmbH