Traffic Diagram
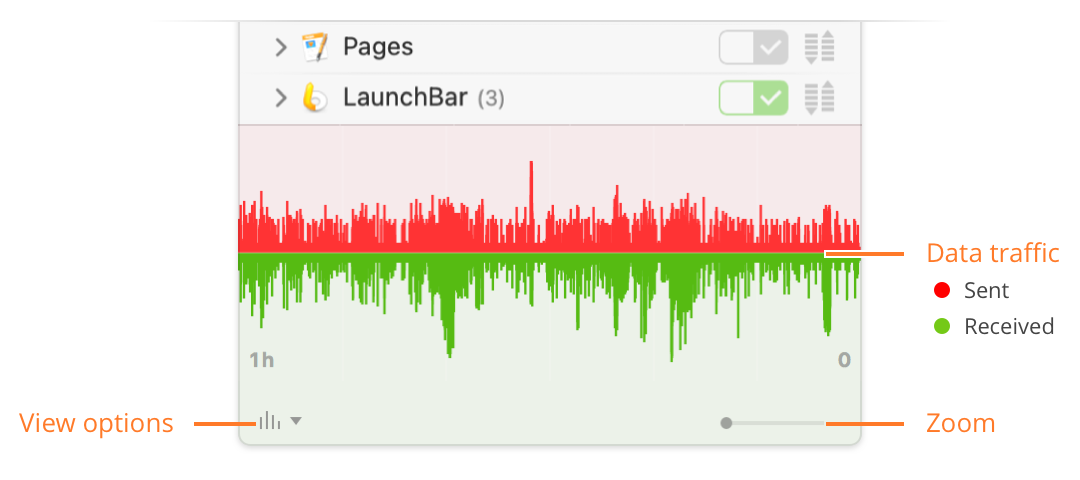
The Traffic Diagram provides a graphical representation of your computer’s recent network activity. It lets you view and analyze total amounts of transmitted data, peak and average data rates, as well as related system events such as application launches or system sleep. It covers one hour of computer up-time and you are able to zoom in on any portion of the graph down to a one minute time frame.
- You can hover over the diagram with the mouse to get an overlay with upload and download data rates for any point of time within the graph.
- Zoom — This slider lets you adjust the zoom level from one hour down to one minute. Alternatively, you can zoom in by selecting an area in the diagram with the mouse (auto-zoom) or with a pinch to zoom gesture on a trackpad.
- View options — This pop-up menu lets you choose between linear and logarithmic data rate display, turn auto-zoom on/off and provides a couple of fixed zoom presets. This menu can also be accessed via right-click into the diagram.
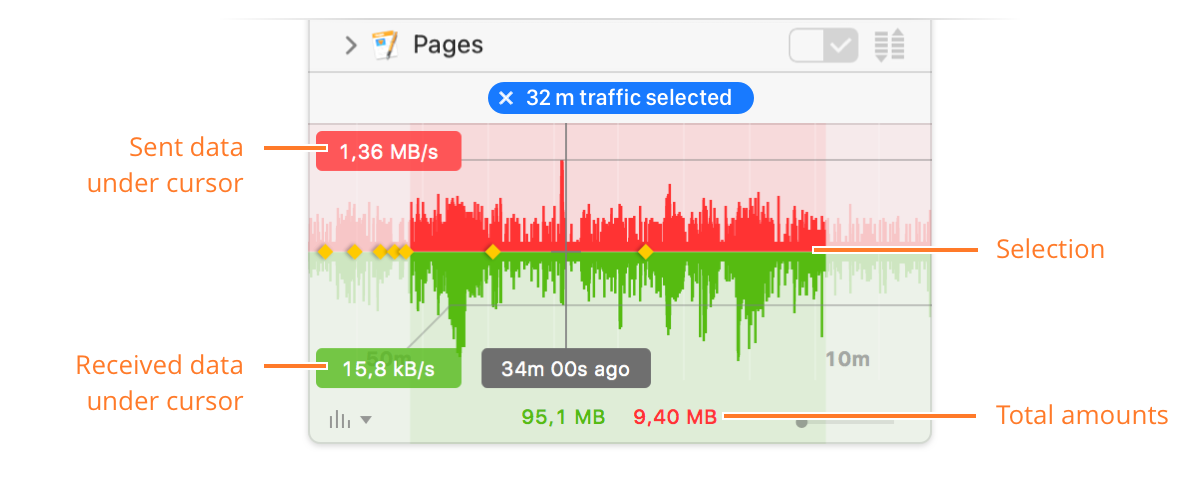
- Data rates at cursor — One second average of the transmit and receive data rates. The values may fluctuate considerably. Make a selection to see averages over a longer interval of time.
- Selection — A time frame can be selected by dragging the mouse over parts of the diagram. The connection list focuses on connections which actually had any traffic during the selected time and statistics for this time interval are computed.
- Total amounts — Shows the total amounts of received and sent data within the selected time frame. You can hold down the Option key to see average data rates instead (averaged over the entire selection).
Who has sent that byte? When you select a time frame in the Traffic Diagram, the connection list and Map View focus on connections that actually had any traffic during that time. If you see a traffic peak in the diagram, you can select it to see which process caused it.
Moving average — The selected area can be moved by holding down the Command key and dragging it with the mouse. Statistics in the total amounts display are updated in real-time. Hence, when you select a one minute time frame and drag it over a download with the Command and Option keys held down, you can inspect the one minute average download rates over time.
War dieser Eintrag hilfreich? Hinterlass uns Feedback.
© 2016-2026 Objective Development Software GmbH