Connection List
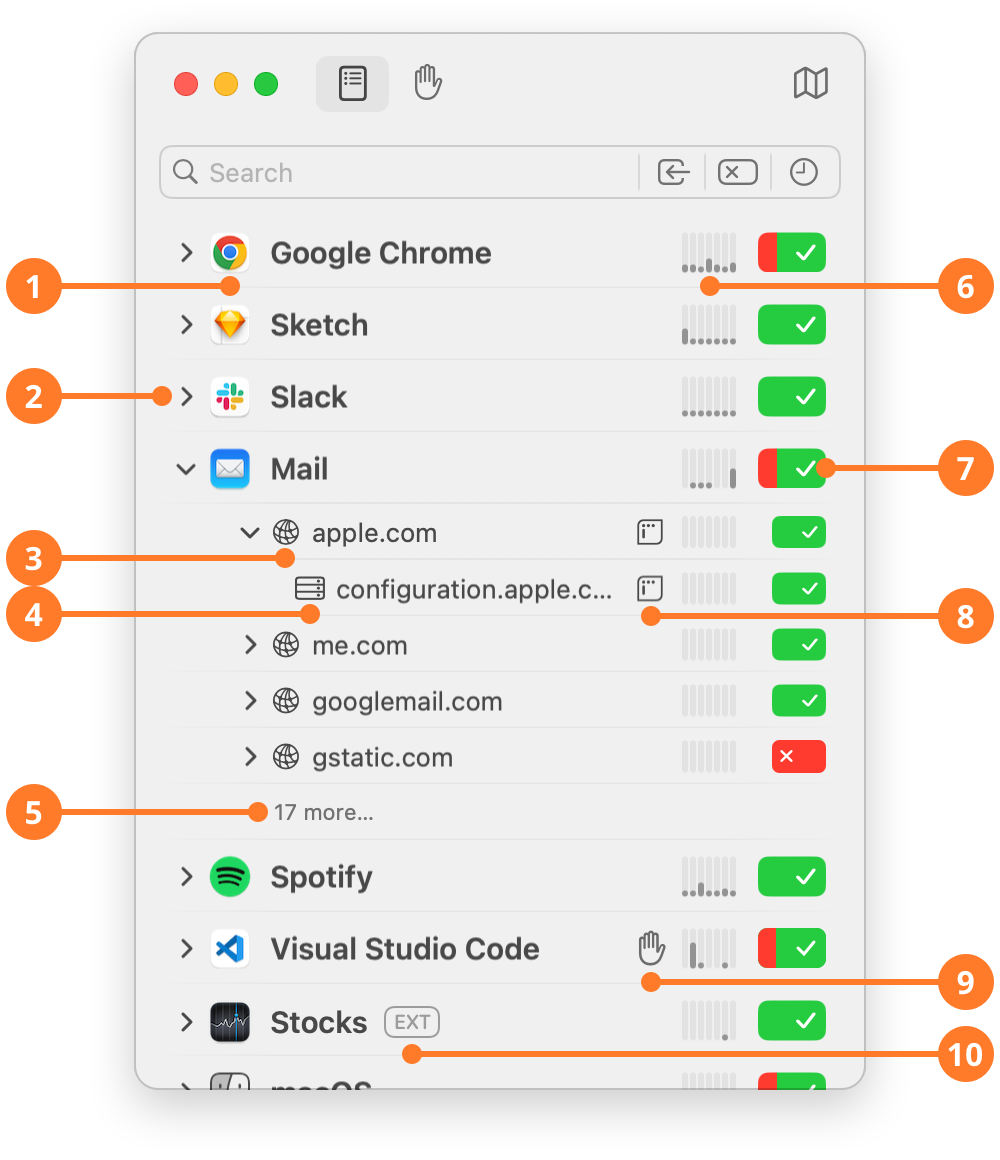
The connection list shows all network activity within a specified time range. This time range can be chosen in the search bar, see Filtering Connections below, for more information.
The view is hierarchical: The first level lists all apps with network activity. Clicking on the disclosure triangle to the left reveals all the domains an app has contacted. In addition, clicking on the triangle of a particular domain reveals all the servers that have been contacted in that domain.

| ITEM | DESCRIPTION |
|---|---|
| 1 | The name and icon of the app with network activity. |
| 2 | The disclosure triangle to expand/collapse connection details. |
| 3 | The contacted domain(s), ordered by recent activity. |
| 4 | The contacted host(s) within that domain. |
| 5 | If a level contains of too many items, only the first four are shown, while others are hidden behind a “more…” button. Clicking this buttons reveal all items at once. |
| 6 | The Traffic Meter showing the amount of data transferred within the last five minutes, each bar representing approx. 40 seconds. Clicking the Traffic Meter shows a detailed traffic chart for more detailed traffic analysis. or more information see section Traffic Chart below. |
| 7 | The Rule Button at the right end shows whether the app is allowed to connect, blocked to establish connections at all or allowed with exceptions, blocking servers or domains in a deeper level. By clicking this button, you can block currently allowed connections or allow currently blocked connections. For more information, see section Rule Button below. |
| 8 |  indicates that this connection is covered by the Internet Access Policy that comes with this app. The IAP provides more information about the purpose of a particular connection and is usually provided by the app developer. Objective Development provides IAP information for apps shipped with macOS. Click the icon to see the information available. indicates that this connection is covered by the Internet Access Policy that comes with this app. The IAP provides more information about the purpose of a particular connection and is usually provided by the app developer. Objective Development provides IAP information for apps shipped with macOS. Click the icon to see the information available. |
| 9 |  indicates that this connection is blocked by one or more entries in one or or more active blocklists. Click this button to see the entries that caused this connection to be blocked. indicates that this connection is blocked by one or more entries in one or or more active blocklists. Click this button to see the entries that caused this connection to be blocked. |
| 10 |  indicates that the network activity was performed by an extension provided by the app. Extensions of apps can extend functionality of macOS (e.g. Finder), other apps or act on behalf of the app itself. The app may even be closed while its extension serves other apps. indicates that the network activity was performed by an extension provided by the app. Extensions of apps can extend functionality of macOS (e.g. Finder), other apps or act on behalf of the app itself. The app may even be closed while its extension serves other apps. |
The macOS Group
macOS, your Mac’s operating system, is comprised of many processes and services. Little Snitch Mini groups all of them together into the “macOS” group. When you expand this group, you see all individual processes. From here on the hierarchy is the same as for apps on the first level: app, contacted domains, and last contacted servers of that domain.
Although you can block apps from connecting at all, you are not allowed to do this for the macOS group itself, as this would affect the correct behaviour of your Mac. You can still block specific processes contained within the macOS group, but be careful, as this may have unexpected side effects.
The Rule Button
The rule button indicates whether none, some or all connections are blocked for a particular app. It can have one of the following states:
| STATE | DESCRIPTION |
|---|---|
 |
All connections are allowed. |
 |
Connections are allowed, except some domains or servers at a deeper level. |
 |
All connections are blocked. |
 |
Connections are blocked, except some domains or servers at a deeper level. |
Click the rule button to change the behavior as follows:
- If all connections are currently allowed, clicking the button blocks them all.
- If all connections are currently blocked, clicking the button allows them all. However, if some connections are covered by a blocklist, these blocklist entries are still active and the button turns into the “allowed except some” state.
- If connections are allowed except some, clicking the button allows all of them. It is the same as if you would click all blocked connections at the deeper level to allow them.
If you block all connections for an app or domain, but some connections at a deeper level had to be allowed explicitly (as override of a blocklist), these explicit allows are removed. Little Snitch Mini shows a warning to let you know because there is no way to get them back except undo.
Actions
You can interact with items of the connection list in the following ways:
- Click on the rule button. This has been explained above.
- Click the traffic meter. This shows a detailed traffic chart which lets you analyze traffic amounts of up to a year.
- Right-click an item. This brings up a menu with all possible actions and options to show more information.
- Undo. Clicks on the rule button can be reverted with Undo. Note that removing an item from the list cannot be undone!
- Delete an item. This option is available from the context menu (right-click) or with Cmd-Delete. The item and all its details are removed from the list and all traffic history related to the item is deleted. There is no undo for this operation!
Traffic Chart
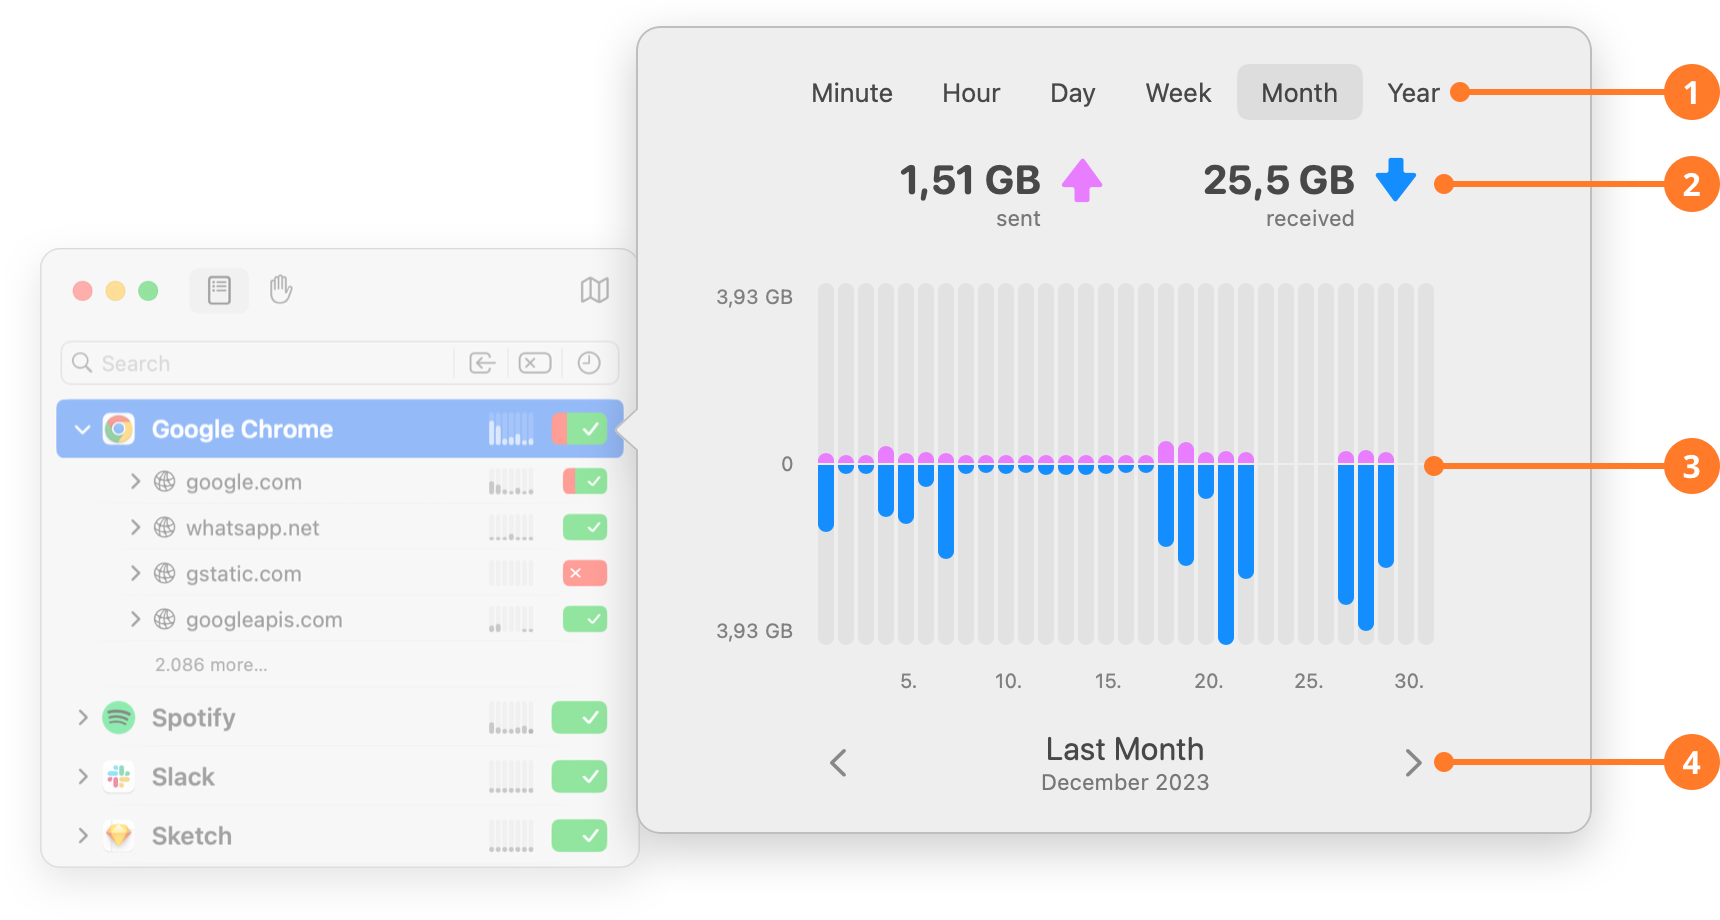
When you click on a traffic meter of an app, domain or host, a chart is shown which represents the outgoing and incoming traffic of that particular selection:

| ITEM | DESCRIPTION |
|---|---|
| 1 | Select the time interval you want to analyze. |
| 2 | The total amount of bytes sent and received during the selected interval. |
| 3 | A graphical representation of the traffic that ocurred during the selected interval. When a single bar is hovered, the values in (2) represent the bytes sent and received in that particular interval. |
| 4 | Navigate back and forth in time, by clicking the left or right arrowed button to the side of the selected intervals detailed information. |
Filtering Connections
When you analyze connections made by your Mac, the amount of information can be overwhelming. In many cases, you may only be interested in a particular server, domain or app, in connections with certain characteristics, things that were blocked or a particular time range.
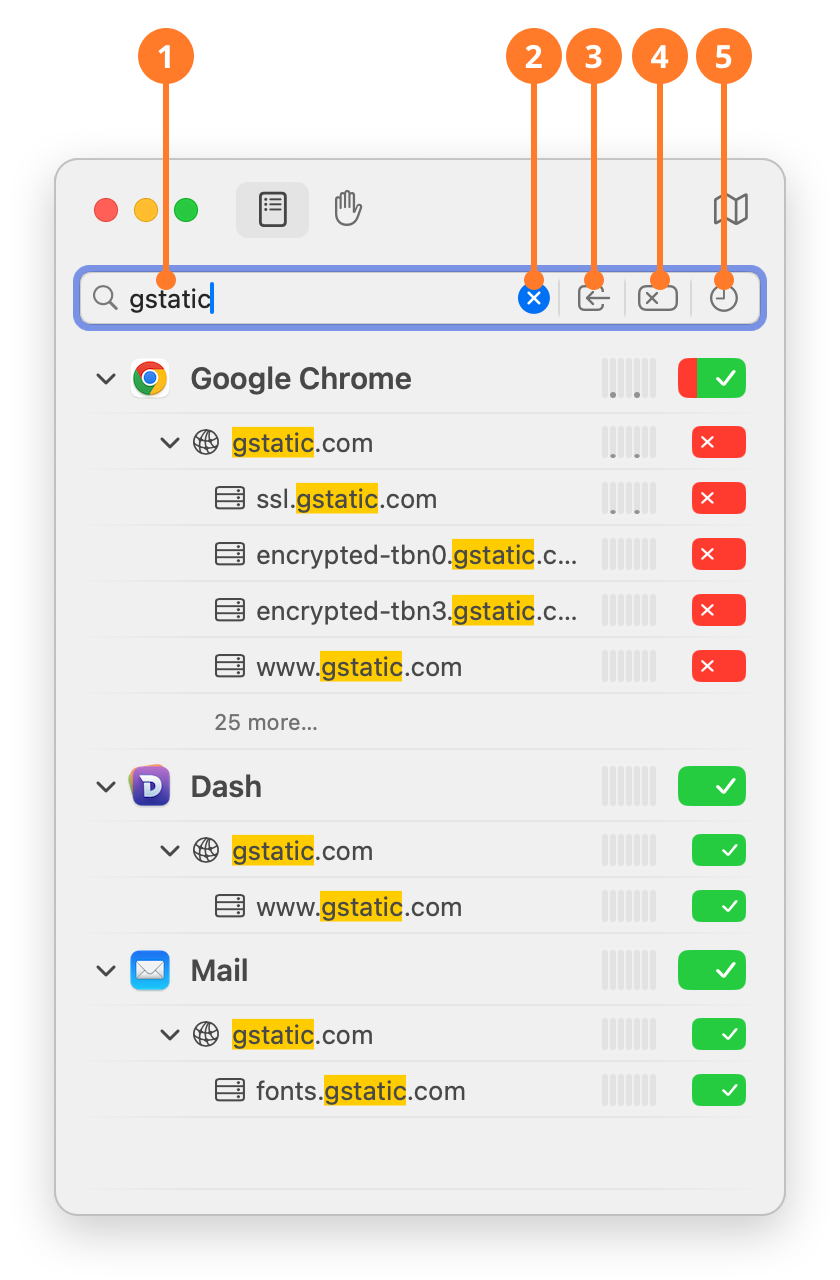
You can narrow down the list to contain only connections with particular properties. You do this in the search bar:

| ITEM | DESCRIPTION |
|---|---|
| 1 | Enter a search term and narrow down the list to items containing the provided string. |
| 2 | Click to clear any previously entered search terms. |
| 3 |  show only incoming connections. These are connections initiated by a remote computer, and accepted by your Mac. show only incoming connections. These are connections initiated by a remote computer, and accepted by your Mac. |
| 4 |  show only connections that are blocked. show only connections that are blocked. |
| 5 |  show only connections with activity in the given time range. show only connections with activity in the given time range. |
All these filter options can be combined and provide a powerful tool for analysis. This is best shown with some examples:
Who uses Google Analytics?
Set the time filter to “Show All” and enter analytics.google.com in the search field. This usually narrows down the list to all the web browsers you use, but in some cases it reveals apps which track users via Google. Also check for google-analytics.com, this is an alternative name used by Google. But don‘t enter both at the same time, Little Snitch Mini would search for items containing both strings.
Did Little Snitch Mini block something recently?
If something is not working as expected, it may be caused by a connection being blocked by Little Snitch Mini. To find out, set the time filter to “Last 5 Minutes” and click “Show only blocked connections”. Now you can see what has been blocked in the last 5 minutes.
Did my Mac act as a server?
Some apps act as a servers. If you install a web or database server, this is obvious. But did you know that macOS itself runs servers that allow access to screen sharing, remote login, file sharing access and similar services (if enabled)? You might want to know whether someone tried to connect to one of these services. Click “Show only incoming connections” to limit the list to these.
Many apps register to receive broadcasts in the local network. These incoming data packets are used to detect services such as printers, file servers and routers automatically. Broadcasts are also shown as incoming connections.
Was this help page useful? Send feedback.
© 2016-2026 by Objective Development Software GmbH